Does Montana Rank Near The Top When It Comes To Speeding Tickets?
For those that remember the "good ole days" there was a time in Montana that you could really let loose, especially when it came to "putting the pedal to the metal".
Back in the day, the speed limits on highways and interstates were more of a suggestion. In fact, Montana was often referred to as the "Montanabahn". This was a reference to the fact that there really wasn't a posted speed limit during the day on several miles of Montana roads, so as long as you were driving at "a reasonable and prudent speed", you were good to go.
That all changed in the late 90s, and while an 80 mph hour speed limit covers much of the state, where does Montana rank when it comes to writing speeding tickets?

According to Insurify, we don't make the Top 10, which I don't know about you, but I'm fine with that. However, a couple of neighboring states do. Both Wyoming and North Dakota make the list with Wyoming coming in 10th place and North Dakota coming in 3rd.
The data is based on drivers with prior speeding tickets and with a national average of around 10 percent, Montana comes in between 7 and 8 percent. What does that translate into? Well, it means that we're one of the lower-ranking states when it comes to receiving speeding tickets.
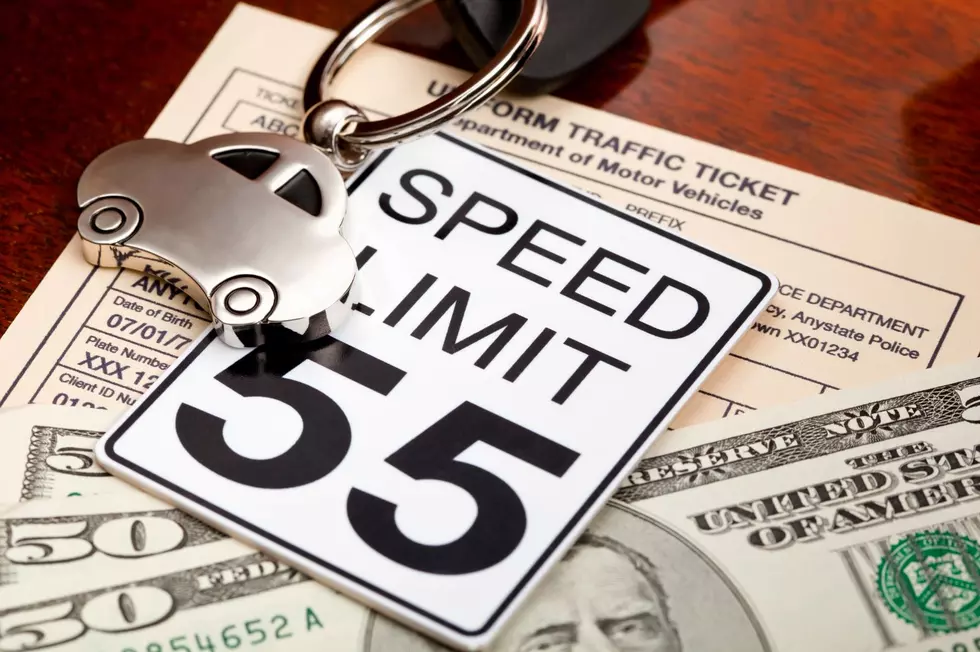
So how much can you expect to pay if you get pulled over for speeding in Montana? According to Mr. Speeding Ticket, here's a breakdown:
- A $20 fine for driving 1-10 miles per hour over the speed limit.
- $70 in fines for driving 11-20 miles per hour over the speed limit.
- A $120 fine for driving 21-30 miles per hour over the speed limit.
- Finally, a $200 fine if caught driving more than 30 miles per hour over the speed limit.
While we would never encourage anyone to break the law if you do find yourself with a bit of a heavy foot, it seems your best option is to stay inside that 20 dollars range. We would also like to take this time to remind you to buckle up, not to text and drive, to keep your eyes on the road, and make sure your lights are on during inclement weather.
Stay safe out there.
LOOK: See the iconic cars that debuted the year you were born
LOOK: See how much gasoline cost the year you started driving
Gallery Credit: Sophia Crisafulli
More From My 103.5 FM